Law enforcement agencies across the country have failed to provide us with even basic information about the lives they have taken. While the Federal government announced in 2016 that they would begin collecting data on deadly force incidents, they have proved either unwilling or unable to do so. For example, their new Use of Force Data Collection program ended up collecting data from so few law enforcement agencies that the entire program could be shut down without the data they’ve collected being made available to the public.
We cannot wait to know the true scale of police violence against our communities. In a country where at least three people are killed by police every day, we cannot wait for police departments to provide us with these answers. The maps and charts on this site aim to provide us with insights into patterns of police violence across the country. They include information on more than 10,000 killings by police nationwide since 2013. 97 percent of the killings in our database occurred while a police officer was acting in a law enforcement capacity. Importantly, these killings represent only part of the broader universe of state-sanctioned violence. For example, the database does not include killings by vigilantes or security guards who are not off-duty police officers. It also does not include the more than 1,000 people who die while incarcerated in county jails and more than 4,000 people who die while incarcerated in state and federal prisons each year, according to the U.S. Department of Justice.
Our data has been meticulously sourced from official police use of force data collection programs in states like California, Texas and Virginia, combined with nationwide data from The Gun Violence Archive and the Fatal Encounters database, two impartial crowdsourced databases. We've also done extensive original research to further improve the quality and completeness of the data; searching social media, obituaries, criminal records databases, police reports and other sources to identify the race of 90 percent of all victims in the database.
We believe the data represented on this site is the most comprehensive accounting of people killed by police since 2013. Note that the Mapping Police Violence database is more comprehensive than the Washington Post police shootings database: while WaPo only tracks cases where people are fatally shot by on-duty police officers, our database includes additional incidents such as cases where police kill someone through use of a chokehold, baton, taser or other means as well as cases such as killings by off-duty police. A recent report from the Bureau of Justice Statistics estimated approximately 1,200 people were killed by police between June, 2015 and May, 2016. Our database identified 1,100 people killed by police over this time period. While there are undoubtedly police killings that are not included in our database (namely, those that go unreported by the media), these estimates suggest that our database captures 92% of the total number of police killings that have occurred since 2013. We hope these data will be used to provide greater transparency and accountability for police departments as part of the ongoing work to end police violence in America.
Updating the Database
The Mapping Police Violence database is updated with new cases every weekend. Since it takes roughly a week to find and code cases, the data and analysis on this site usually includes all killings by police that occurred up to the end of the prior week. Additionally, we conduct quarterly reviews of cases from prior years to ensure our database remains complete and up-to-date.
Definitions
Police Killing: A case where a person dies as a result of being shot, beaten, restrained, intentionally hit by a police vehicle, pepper sprayed, tasered, or otherwise harmed by police officers, whether on-duty or off-duty.
A person was coded as Unarmed/Did Not Have a Weapon in the database if they were one or more of the following:
not holding any objects or weapons when killed
holding household/personal items that were not used to attack others (cellphone, video game controller, cane, etc.)
holding a toy weapon (BB gun, pellet gun, air rifle, toy sword)
an innocent bystander or hostage killed by a police shooting or other police use of force
a person or motorist killed after being intentionally hit by a police car or as a result of hitting police stop sticks during a pursuit
A person was coded as having a Vehicle as a weapon if they were one or more of the following:
a driver who was killed while hitting, dragging or driving towards officers or civilians
a driver who was driving and/or being pursued by police at high speeds, presenting a danger to the public
people who were killed by a civilian driver or crashed without being hit directly and intentionally by police during a police pursuit are not included in the database. Note that an estimated 300 people are killed in police pursuits each year and only a small proportion of these cases are included in the database (most deadly pursuits end after the driver crashes themselves into something or hits a civilian vehicle without being directly rammed/hit by police).
A person was coded as Allegedly Armed in the database if they:
were alleged to have possessed objects or weapons in circumstances other than those stated above
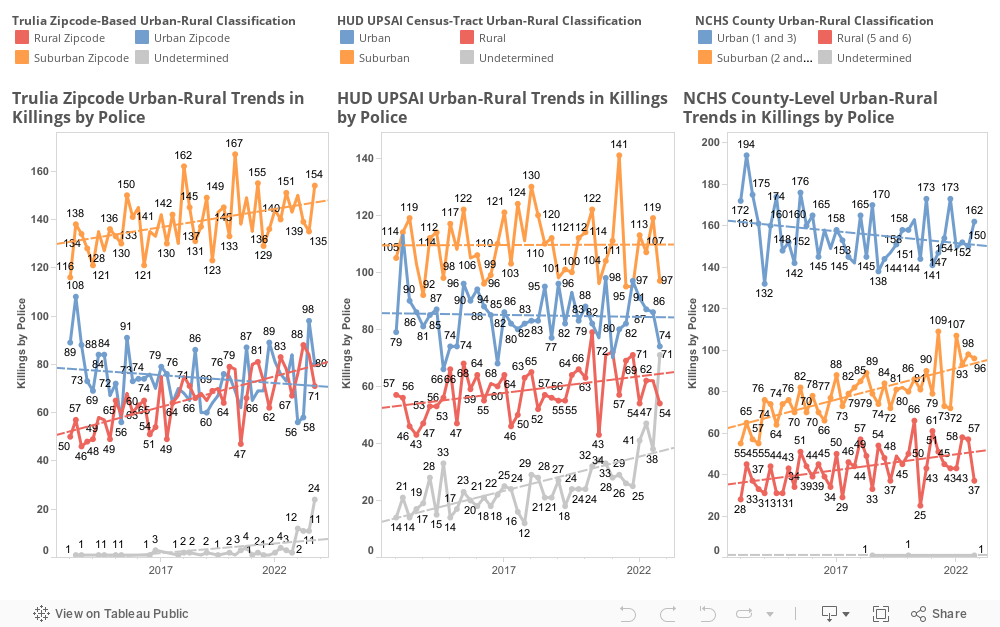
Urban/Suburban/Rural Geography Measures:
In order to assess changes in the geography of killings by police over time, the Mapping Police Violence database includes three different geographic measures that each have their own strengths and limitations:
First, we utilize a zip code-based measure developed by the real-estate company Trulia that assigns urban/suburban/rural categories to based on the population density of each incident’s Zip Code Tabulation Area (ZCTA), according to 2010 Census population estimates. This measure permits a more detailed and granular analysis of the geographic landscape of police violence, including differences between urban/suburban/rural zip codes within cities, counties or broader metropolitan areas that would more broadly be coded as urban areas using other methods. Using this method, zip codes with more than 2,213 households per square mile are coded as urban, zip codes with between 102-2213 households per square mile are coded as suburban and zip codes with fewer than 102 households per square mile are coded as rural. However, since this method relies on 2010 Census data to determine the number of households in each zip code, this method is more vulnerable to shifts in the urbanicity/rurality of particular places over the past decade.
The second geographic measure included in our database is the Urbanization Perceptions Small Area Index (UPSAI) measure developed by the US Department of Housing and Urban Development. This measure assigns urban/suburban/rural geographies to census tracts based on how residents classify their own neighborhoods in the American Housing Survey, a survey of 76,000 households in 2017. While this measure also provides more detailed data than county-level analyses and more up-to-date data than the zip code-based method, fewer cases are able to be coded using this methodology due to missing UPSAI geographic classifications for some census tracts.
The third geographic measure is Urban-Rural Classification Scheme developed by the National Center for Health Statistics. This measure is the broadest in geography - assigning urban/suburban/rural geographies based on 2013 estimates of each county’s population and proximity to the Metropolitan Statistical Area’s principal city. Using this method, Large Central Metro (1) and Medium Metro (3) counties are classified as urban areas in our database, Large Fringe Metro (2) and Small Metro (4) counties are classified as suburban, and Micropolitan (5) and Non-Core (6) areas are classified as rural. However, since this method classifies entire counties, it does not permit the more granular within-city or within-county level analyses permitted by the other two methods.
Encounter Types and Initial Reported Reason for Encounter:
Since 2017, Mapping Police Violence has expanded the scope of data collection to include information on the initial reported reason(s) for police to be on the scene prior to using deadly force. This information is obtained from a review of existing media reports on each case as well as statements from police, prosecutors, and other officials. These initial reported reasons are grouped into broader Encounter Types that are standardized within the following taxonomy, ranked in order of severity whereby cases are coded according to the most severe encounter type:
Violent Crime: this includes cases where officers engaged the person because of reported or suspected murder, rape, robbery, aggravated assault, assault with a deadly weapon, or shooting/shots fired including reported attempts to commit these offenses and executing warrants related to these offenses.
Other Crimes Against People: includes offenses not classified as Part 1 Violent Crimes but that nevertheless involve causing harm to other people including assault (without a weapon), battery, sex offenses not including rape, domestic assault (without a weapon), child abuse, kidnapping and any warrants related to these offenses
Person with a Weapon: a person reported for being seen with a gun or other weapon, though no violent crimes or crimes against people were reported
Other Non-Violent Offenses: cases involving alleged offenses that are not classified as violent crimes or crimes against people (for example, cases involving alleged drug offenses, trespassing, theft, fraud, etc.), including warrants involving non-violent offenses and cases where a person is pulled over by police for a specific non-traffic related offense or warrant.
Mental Health/Welfare Check: cases where police initially encounter the person in response to reports or observations that they were acting “erratically,” “suicidal,” “disorderly,” reports of a person in need of medical/mental health care or otherwise in need of someone to check on their welfare with no other specific offenses alleged.
Domestic Disturbance: cases where officers respond to an alleged domestic disturbance. Cases where officers responded to reports that indicated the person was committing a violent crime (i.e. aggravated assault/assault with a deadly weapon) or crime against a person (domestic assault or battery) in the context of a domestic disturbance are coded as Violent Crimes or Other Crimes Against People, consistent with the most severe offense alleged.
Traffic Stop: cases where police initially encounter the person because of a traffic violation or traffic-related offense, regardless of whether any other offenses are reportedly discovered after the person has already been stopped by police
None/Unknown: cases involving non-criminal situations such as car crashes as well as situations where generalized “suspicion” was cited as the reason for officers to engage with someone despite no specific offense being alleged
Data on Officers and Case Outcomes:
The Mapping Police Violence database includes information on the officers involved in each case (both the officers who killed the person and any other officers on the scene during the use of deadly force), including the names and race of the officers, any prior deadly force incidents involving that officer that have been reported by the media, and whether the case resulted in any administrative discipline, civil suits and/or misconduct settlements. This information is among the most difficult to obtain, especially in states that restrict or prohibit information about police misconduct or discipline from being made public. As such, we expect this information to provide important, albeit incomplete, insights into the officers who engage in fatal police violence. We will continue to add more data on these topics over time as more info are reported by officials and the media.
Additionally, Mapping Police Violence tracks cases where officers have been charged with a crime related to an incident of fatal police violence. These data are collected initially from ongoing monitoring of media reports related to each case in our database. We also worked with Professor Phil Stinson at the Henry A. Wallace Police Crime Database, the most complete database of officers who’ve been charged with crimes nationwide, to ensure that all known cases where officers were charged with a crime related to the use of deadly force since 2013 in their database are also included in the Mapping Police Violence database. Data on case outcomes and other details about each case are collected and updated on an ongoing basis, with the date of latest update noted in the Official disposition of death column of our database. This data includes what charges officers faced, whether any officers were convicted of a crime, and the sentence imposed, where such information are available.